Optimizing MLB Pitching: A Deep Dive into Pitch Selection and Performance
Explore how MLB pitchers optimize their pitch selection using advanced analytics and game theory, highlighting the most and least balanced pitchers in the league.

Introduction
Pitching in Major League Baseball (MLB) is as much an art as it is a science. With the advent of advanced analytics, pitchers can now fine-tune their arsenals to maximize effectiveness. This article delves into the concept of Nash Scores, a metric rooted in game theory, to evaluate how pitchers are optimizing their pitch selection.
The Science Behind Pitch Selection
Modern pitchers rely on a combination of data and intuition to keep hitters guessing. The shape, spin, and velocity of each pitch are meticulously analyzed to create a repertoire that can confound even the best hitters. However, despite this sophistication, inefficiencies in pitch deployment can still exist.
Understanding Nash Scores
The Nash Score, named after the Nash equilibrium in game theory, compares the runs a pitcher saves with each pitch to the average runs saved by all of his other pitches combined. A low Nash Score indicates a balanced pitch mix, while a high score suggests potential inefficiencies.
Top Optimized Starters
Here are the top 15 starters who have achieved the greatest balance in their pitch selection over the past three seasons:
| Pitcher | Team(s) | WAR | Nash Score | No. 1 Pitch | No. 2 Pitch |
|---|---|---|---|---|---|
| Jake Irvin | WSN | 4.1 | 0.05 | 4-Seam FB (35%), +0.13 | Curveball (33%), -0.13 |
| Garrett Crochet | CHW, BOS | 6.7 | 0.06 | 4-Seam FB (49%), -0.14 | Cutter (28%), +0.18 |
| Kutter Crawford | BOS | 4.6 | 0.09 | 4-Seam FB (35%), -0.11 | Cutter (31%), +0.43 |
| Jesus Luzardo | MIA, PHI | 6.4 | 0.11 | 4-Seam FB (40%), -0.20 | Slider (32%), +0.46 |
| Ryan Pepiot | LAD, TBR | 4.3 | 0.11 | 4-Seam FB (48%), +0.32 | Changeup (24%), -0.37 |
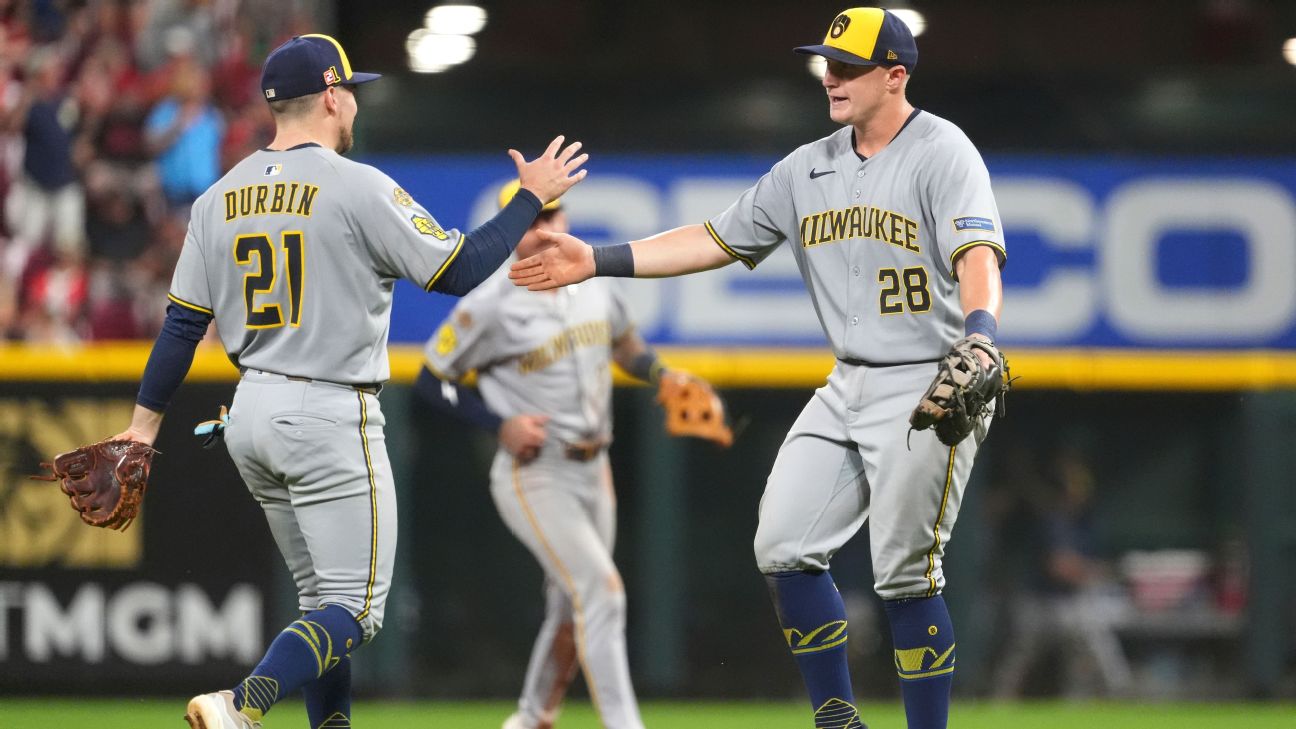
| Freddy Peralta | MIL | 7.3 | 0.15 | 4-Seam FB (55%), +0.08 | Changeup (18%), +0.67 |
| Taj Bradley | TBR | 1.8 | 0.21 | 4-Seam FB (43%), -0.57 | Cutter (22%), +0.22 |
| Taijuan Walker | PHI | 1.8 | 0.25 | Splitter (26%), -0.57 | Sinker (23%), -0.16 |
| Corbin Burnes | MIL, BAL, ARI | 9.2 | 0.34 | Cutter (50%), +0.57 | Curveball (20%), +0.03 |
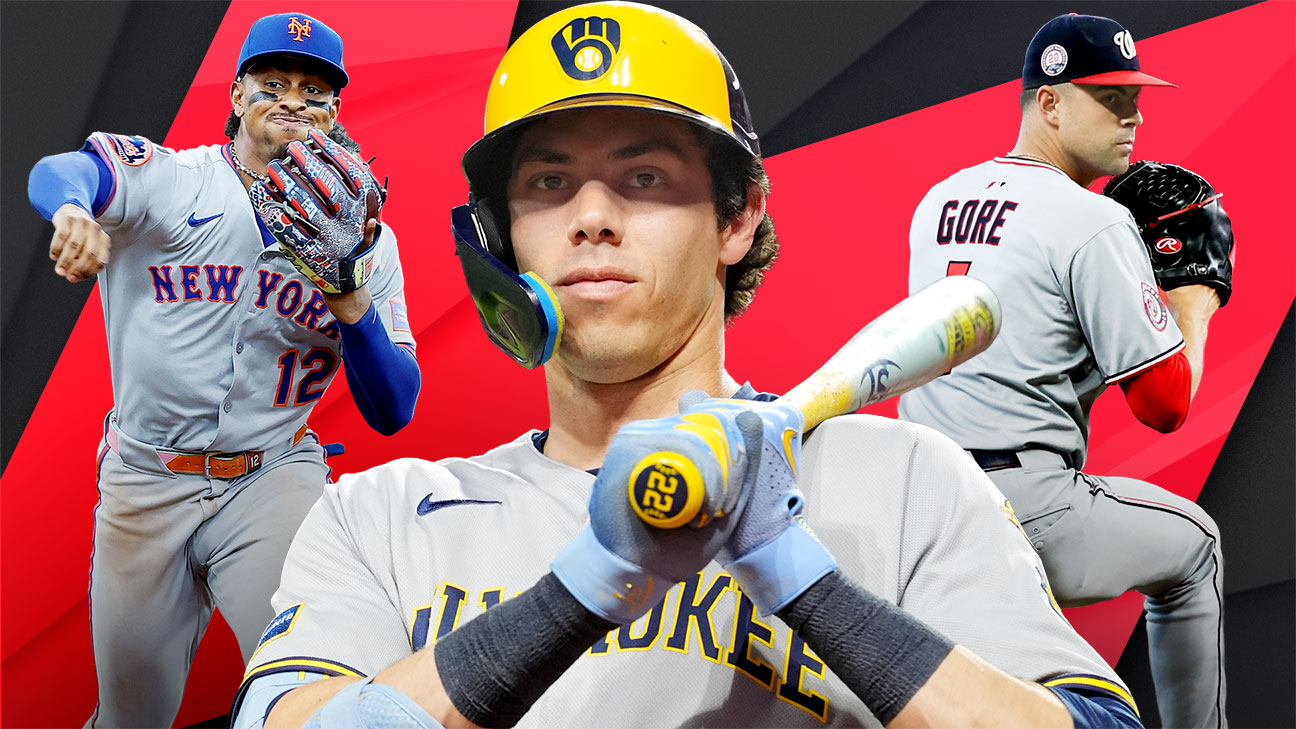
| MacKenzie Gore | WSN | 6.1 | 0.36 | 4-Seam FB (54%), +0.04 | Curveball (21%), +0.31 |
| Tarik Skubal | DET | 12.5 | 0.37 | 4-Seam FB (32%), -0.05 | Changeup (28%), +0.62 |
| Justin Verlander | HOU, NYM, SFG | 3.9 | 0.39 | 4-Seam FB (49%), -0.09 | Slider (25%), +0.94 |
| Nathan Eovaldi | TEX | 8.2 | 0.41 | 4-Seam FB (35%), -0.30 | Splitter (30%), +0.84 |
| Jameson Taillon | CHC | 4.2 | 0.42 | 4-Seam FB (34%), -0.48 | Cutter (20%), +0.44 |
| Reese Olson | DET | 4.5 | 0.42 | Slider (27%), +0.47 | Sinker (24%), +0.15 |
Top Optimized Relievers
Relievers often have simpler repertoires, making it easier to achieve a balanced pitch mix. Here are the top 15 relievers who have excelled in this area:
| Pitcher | Team(s) | WAR | Nash Score | No. 1 Pitch | No. 2 Pitch |
|---|---|---|---|---|---|
| Paul Sewald | ARI, SEA, CLE | 1.2 | 0.01 | 4-Seam FB (58%), +0.05 | Slider (41%), -0.06 |
| Colin Poche | TBR, WSN | 1.2 | 0.01 | 4-Seam FB (68%), +0.11 | Slider (32%), -0.11 |
| Tanner Scott | MIA, SDP, LAD | 6.2 | 0.03 | 4-Seam FB (56%), -0.14 | Slider (44%), +0.15 |
| Joe Jimenez | ATL | 2.5 | 0.03 | 4-Seam FB (51%), -0.06 | Slider (44%), -0.08 |
| Alexis Díaz | CIN | 1.6 | 0.03 | 4-Seam FB (56%), -0.18 | Slider (44%), +0.18 |
| Orion Kerkering | PHI | 1.8 | 0.03 | Slider (56%), +0.06 | 4-Seam FB (28%), -0.26 |
| A.J. Minter | ATL, NYM | 2 | 0.08 | 4-Seam FB (46%), -0.02 | Cutter (39%), +0.30 |
| Elvis Peguero | MIL | 1.1 | 0.08 | Slider (50%), +0.27 | Sinker (50%), -0.26 |
| Brad Keller | KCR, BOS, CHW, CHC | 0.6 | 0.09 | 4-Seam FB (39%), +0.07 | Slider (37%), +0.07 |
| Edwin Diaz | NYM | 1.6 | 0.1 | 4-Seam FB (52%), +0.31 | Slider (48%), -0.31 |
| Jeremiah Estrada | CHC, SDP | 1.6 | 0.1 | 4-Seam FB (61%), -0.10 | Slider (20%), -0.36 |
| Kyle Finnegan | WSN | 2 | 0.12 | 4-Seam FB (68%), +0.31 | Splitter (28%), -0.10 |
| Luis Garcia | SDP, BOS, LAA, LAD | 0 | 0.12 | Sinker (45%), -0.32 | Slider (29%), -0.05 |
| Ryan Walker | SFG | 3.1 | 0.15 | Sinker (55%), +0.07 | Slider (44%), +0.01 |
| Craig Kimbrel | PHI, BAL, ATL | 0.8 | 0.15 | 4-Seam FB (66%), +0.26 | Kn. Curve (30%), -0.37 |
Conclusion
Nash Scores provide a unique lens through which to view pitcher performance. By analyzing pitch selection and effectiveness, we can identify pitchers who are maximizing their arsenals and those who may need to adjust their strategies. Whether you're a fan, analyst, or player, understanding these metrics can offer valuable insights into the complex world of MLB pitching.

Petrojet
01:00 Egypt, Premier League, Round 8

01:00

Ghazl El-Mehalla

Zed FC
01:00 Egypt, Premier League, Round 8
01:00

Al Ittehad

Sporting CP
03:15 Portugal, Liga Portugal, Round 6
03:15

Moreirense

Haras El Hodood
22:00 Egypt, Premier League, Round 8
22:00

Al Ahly SC

Levante
03:30 Spain, LaLiga, Round 6
03:30

Real Madrid
What to Read Next